
Trustworthy AI starts with a clear understanding of the data behind it. Before a dataset is used for training, testing, validation or decision support, users need to know whether it is reliable, relevant and appropriate for the intended task. A dataset may contain valuable information, but it may also include redundancy, hidden relationships, limitations or biases that can influence model behaviour and downstream decisions.
This is where the Data Valuation Engine becomes relevant. Data valuation is not only about measuring data quality in general terms. It is about understanding how data contributes to AI and analytics workflows: which variables are related, which features influence model behaviour, whether data may introduce unfair outcomes, and whether the dataset is suitable for downstream use.
The Data Valuation Engine (DVE)
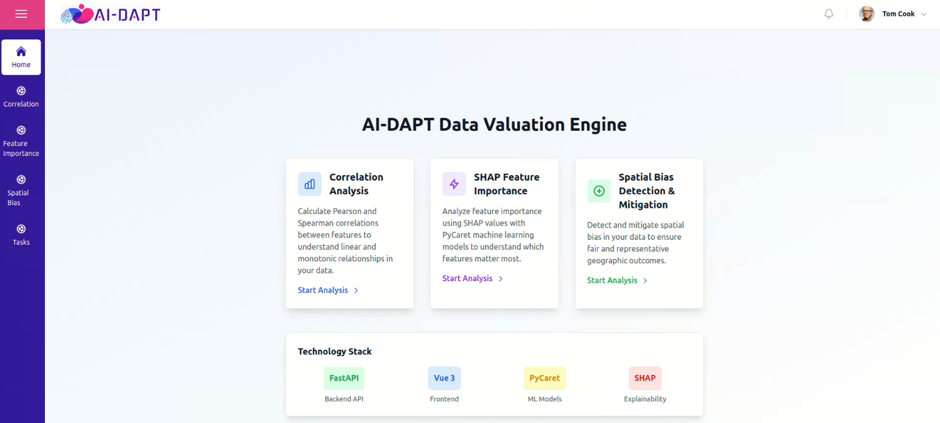
The Data Valuation Engine provides a set of services to support data assessment and audit workflows. It helps users evaluate whether a dataset is suitable for AI by analysing data quality, identifying potential bias, detecting data limitations, and surfacing the data dimensions that most influence model behaviour and downstream decisions.
The engine supports different types of analysis, including correlation analysis, feature importance and spatial bias assessment and mitigation. These methods address complementary questions. Correlation analysis helps users understand relationships between numeric features. Feature importance helps identify which variables are most relevant for predicting a target. Spatial bias analysis helps assess whether model outputs behave differently across geographic regions.
The DVE can be used directly through its own interface or integrated into broader AI-DAPT workflows through the DAVE pipeline manager. In this way, users can perform standalone data assessments or include valuation and audit tasks as part of end-to-end AI pipelines, supporting data validation before model training, testing or deployment.
👉 Prefer to see it immediately in action? Jump directly to the demo video below.
Understanding Relationships in Data
One of the first ways to understand a dataset is to analyse how its variables relate to each other. The Data Valuation Engine supports this through Correlation Analysis, which computes pairwise correlations between numeric features and presents the results as correlation matrices. The AI-DAPT Correlation Analysis interface presents a short summary of the selected dataset, providing context about the data asset under analysis and helping users interpret the results in relation to the correct dataset version and processing stage.
Users can then select the dataset features that should participate in the analysis, allowing them to focus on the variables that are most relevant to the question at hand. Different correlation methods are available depending on the type of relationship users want to inspect. Pearson correlation is useful for linear relationships, while Spearman correlation can capture monotonic relationships and is more robust to non-linear patterns and outliers. The results are displayed through heatmaps, as shown in Figure 2, where values and colours help users quickly interpret the strength and direction of relationships between variables.
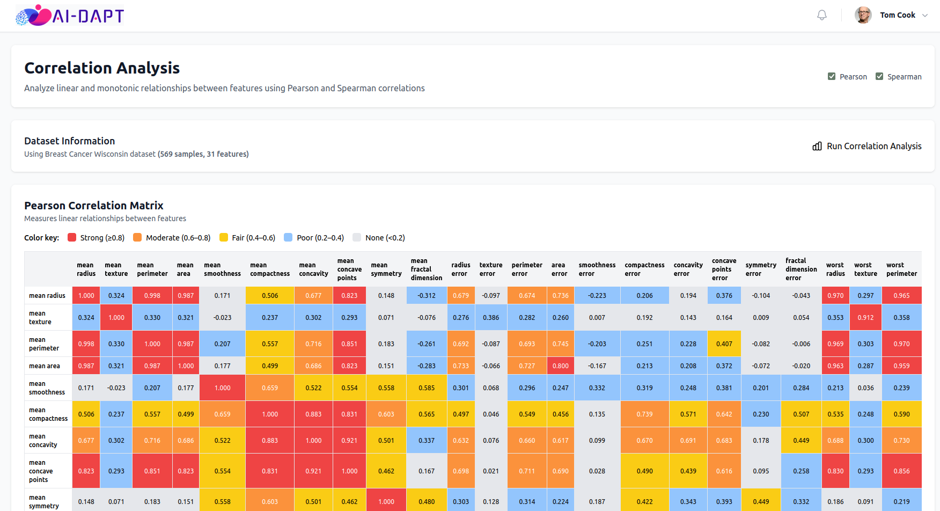
This type of analysis is useful for identifying redundant features, potential multicollinearity and groups of variables that behave similarly. A strong positive correlation indicates that two variables tend to increase together, while a strong negative correlation indicates that one tends to decrease as the other increases. Values close to zero suggest weak or no association.
Correlation analysis should be interpreted carefully. A strong correlation does not prove causation, but it provides an important exploratory signal. It helps users better understand the internal structure of a dataset before moving into feature engineering, modelling or decision-making tasks.
Identifying Influential Features
Beyond understanding relationships between variables, users often need to know which features matter most for a specific prediction task. The Data Valuation Engine supports this through Feature Importance analysis. This method evaluates the contribution of input features to a target variable. The engine applies a set of tree-based models, including Decision Tree, Random Forest, Extra Trees and LightGBM, evaluates them using cross-validation, and then explains the best-performing model using SHAP-based feature importance results.
The output illustrated in Figure 3 helps users identify which variables have the greatest influence on model predictions. This can support feature selection, model interpretation and data understanding. For example, if a small number of features dominate the prediction, users may want to inspect whether those features are reliable, whether they encode sensitive information, or whether they create unwanted dependencies in the model.
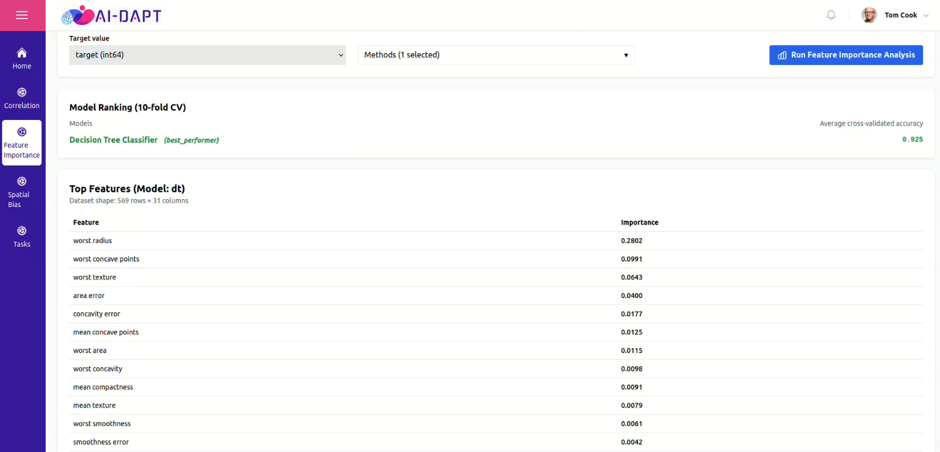
Feature importance is especially useful because it connects data assessment with model behaviour. It does not simply describe the dataset in isolation, but helps users understand which parts of the data are most relevant for predictive performance. At the same time, the results should not be interpreted as causal explanations. They explain how a trained model uses the available features, not why the real-world outcome occurs.
Auditing and Mitigating Spatial Bias
The Data Valuation Engine also includes a Spatial Bias Analysis tool, designed to audit and address fairness issues linked to geographic location. This is important when model predictions may vary across regions in ways that could lead to unequal outcomes.
Spatial bias can appear when some regions are treated more favourably or less favourably than others. For example, a model may predict the positive class more often in certain areas, or achieve better recall in some regions than in others. The Spatial Bias Analysis tool evaluates whether these differences are statistically meaningful rather than simply the result of randomness or small sample sizes.
The tool supports two fairness notions: Statistical Parity, which compares positive rates across regions, and Equal Opportunity, which compares true positive rates among actual positives. In audit mode (see figure 4), the tool computes per-region bias scores, applies statistical testing and produces maps and tables that highlight where significant spatial deviations occur. This helps users move from abstract fairness concerns to concrete evidence. Instead of only knowing that a model may be biased, users can inspect which regions are affected, whether they are favoured or unfavoured, and whether the deviation is statistically significant.
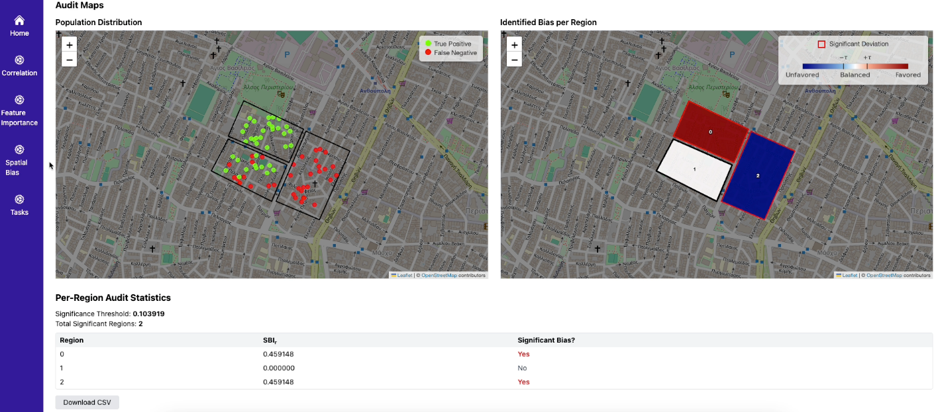
However, the Spatial Bias Analysis tool does not stop at detection. It can also support mitigation workflows when spatial bias is identified. Two mitigation modes are supported. The first is Mitigation through Relabeling, where a limited number of binary outputs are modified to reduce spatial bias while controlling the impact on overall outcomes. The second is Mitigation through Decision Boundary Adjustment, where different decision thresholds are learned per region, allowing the mitigation strategy to generalise to new instances.
In both cases, the tool compares results before and after mitigation. Users can inspect performance and bias metrics, population maps, flip maps, fairness heatmaps and per-region statistics. Mitigated predictions can also be downloaded or written back to the target collection, making the results available for downstream workflow steps. This is particularly important in AI pipelines where bias assessment should not be a one-off report, but part of a broader process of improving data and model behaviour.
By supporting both audit and mitigation, the Data Valuation Engine helps users identify fairness issues and explore controlled ways to reduce them.
Data Valuation in AI-DAPT Pipelines
A key strength of the Data Valuation Engine is that it can also be used within DAVE, the AI-DAPT pipeline manager, as a human-in-the-loop operator. This is useful when data valuation is not only an exploratory analysis, but a decision point that should influence the next steps of an AI workflow.
The main advantage of this integration is that the pipeline can combine automation with controlled human intervention. Automated steps can prepare or load the data, the DVE operator can pause the pipeline when expert judgement is required, and the workflow can continue only after the user has inspected the results and completed the valuation task. This is particularly important for spatial bias analysis and mitigation. A user may need to review the detected bias, decide whether mitigation is appropriate, select the mitigation strategy, and approve the resulting output. Once this action is completed, the pipeline can continue with the updated data, including new mitigation outputs such as adjusted predictions.
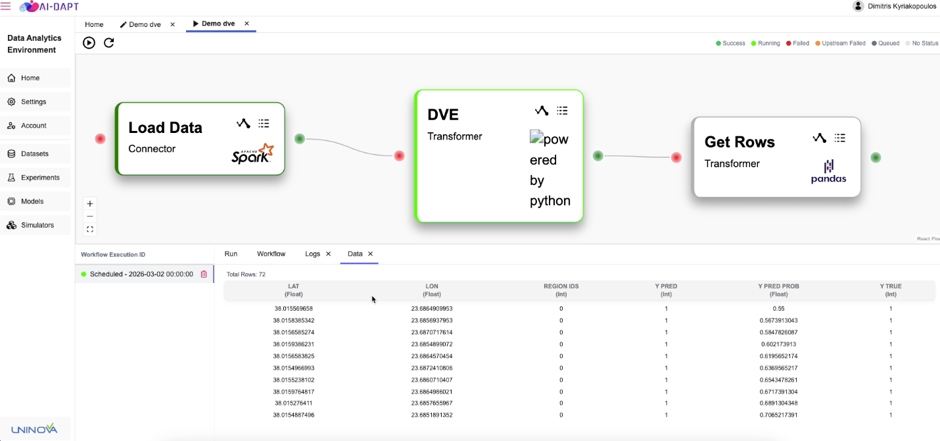
In this way, DVE integration in DAVE turns data valuation from an isolated assessment into an operational checkpoint. It makes the audit or mitigation decision traceable, ensures that downstream steps use the approved output, and reduces the risk of manually transferring results between separate tools.
Watch It in Action 🎥
To bring the Data Valuation Engine component to life, we are releasing a new video that shows it in action.
The video starts with the Correlation Analysis tool, followed by Feature Importance, and then presents Spatial Bias Analysis through its integration with DAVE. The demonstration shows how users can inspect relationships between features, identify influential variables, audit spatial fairness, apply mitigation strategies and return the resulting outputs to the pipeline for downstream use.
Stay tuned for future videos of our conpoments!