
In many AI projects, deploying a model is not the end of the process. Once models start operating in real-world environments, the data they receive may change, the relationships learned during training may become less reliable, and performance may gradually degrade. A model that worked well during testing can therefore become less accurate, less stable or less trustworthy over time.
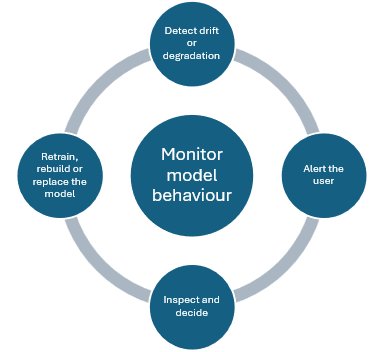
This is why AI systems need to be monitored after deployment. Users need to understand whether a model is still behaving as expected, whether the input data has shifted, and whether alerts or corrective actions are needed. At the same time, adaptation should not be treated as a fully automatic black-box process. In many operational contexts, users must remain involved in inspecting alerts, validating recommendations and deciding whether a model should be retrained, rebuilt or replaced.
This post introduces two complementary AI-DAPT components: the Model Observability Service and the Adaptive AI Service. Together, they support a continuous monitoring and adaptation loop for machine learning models in operation: observe model behaviour, detect drift or degradation, alert the user, support inspection and decision-making, and enable adaptation actions when needed.
Model Observability and Adaptive AI
The Model Observability Service is responsible for monitoring the behaviour, performance and health of machine learning models over time. It calculates observability metrics that help users understand whether a deployed model is still performing as expected and whether the data it receives is changing in ways that may affect its reliability.
The Adaptive AI Service builds on these observability results. It uses model and data metrics, together with user-defined rules, to generate alerts and support adaptation actions. These actions may include retraining, rebuilding or replacing a model, depending on the situation and the level of automation selected by the user.
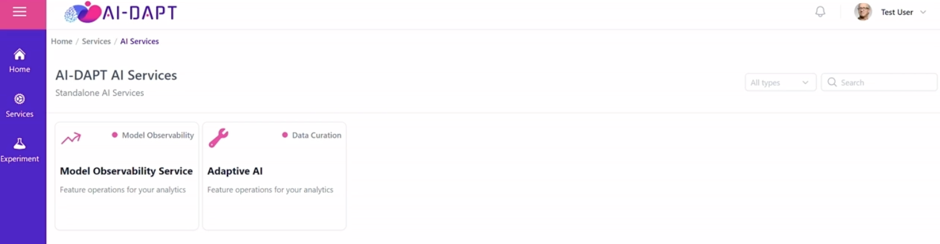
These two services are presented as part of the same operational flow. The Model Observability Service is first configured to monitor a model, compare monitored data with reference data, select metrics and detect drift. The Adaptive AI Service then uses the resulting alerts to support adaptation decisions and actions.
👉 Prefer to see it immediately in action? Jump directly to the demo video below.
Monitoring Models After Deployment
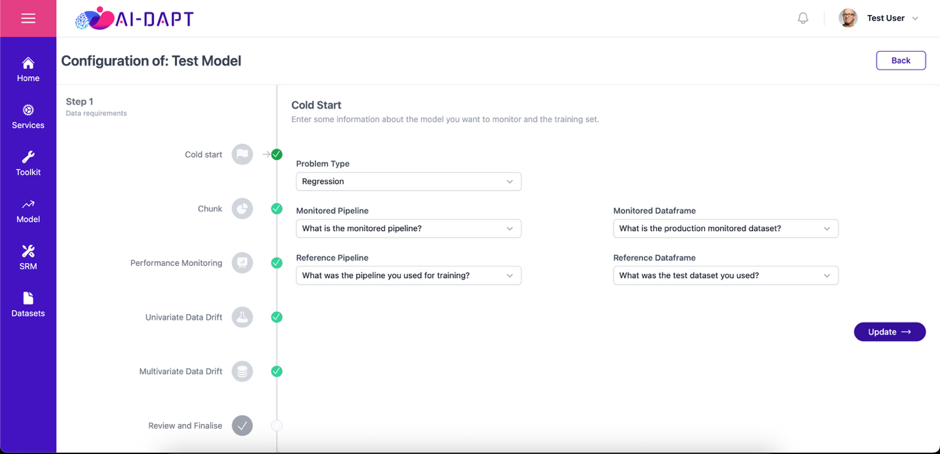
The Model Observability Service supports users in setting up monitoring for machine learning models already available in the AI-DAPT platform. The objective is to define the context in which a model should be observed: what type of problem it addresses, which data should be monitored, what baseline should be used for comparison, and which indicators should be tracked over time. The service currently supports single-output regression, binary classification and multiclass classification problems. This allows observability projects to be adapted to different types of models and performance indicators.
A central element of the configuration is the distinction between monitored data and reference data (see Figure 3). The monitored dataset represents the data on which the model is being observed in operation, while the reference dataset provides the baseline against which current behaviour is compared. This baseline is typically linked to the model’s post-training inference phase and includes the relevant input features, predictions and ground truth labels. For the comparison to be meaningful, both datasets need to follow the same schema.
The service also allows users to decide how monitoring should be organised over time. Instead of analysing all production data as a single block, observations can be grouped by time period or by chunk size. This makes it possible to track model behaviour progressively and identify whether changes emerge gradually, periodically or in specific data segments.
Once this monitoring context is defined, users can select the observability metrics and thresholds that should be applied. These include metrics related to model quality, performance estimation, descriptive statistics, outlier detection and drift detection. Thresholds can be defined manually or configured automatically based on the reference data, allowing the system to identify when a monitored metric moves outside the expected range. Univariate drift detection examines selected features individually, while multivariate drift detection considers how groups of features behave together. This is important because model degradation may be caused not only by changes in one input variable, but also by shifts in the relationships between multiple features.
By combining problem type, reference data, monitored data, aggregation strategy, metrics, thresholds and drift checks, the Model Observability Service creates the basis for continuous model monitoring. It gives users a structured way to define what “normal” model behaviour looks like and how deviations from that behaviour should be detected.
Understanding Observability Results
Once monitoring is configured, the observability results are presented through a dedicated dashboard, designed to help users understand not only whether alerts have been triggered, but also how the model is behaving over time and where potential issues may originate (see Figure 4).
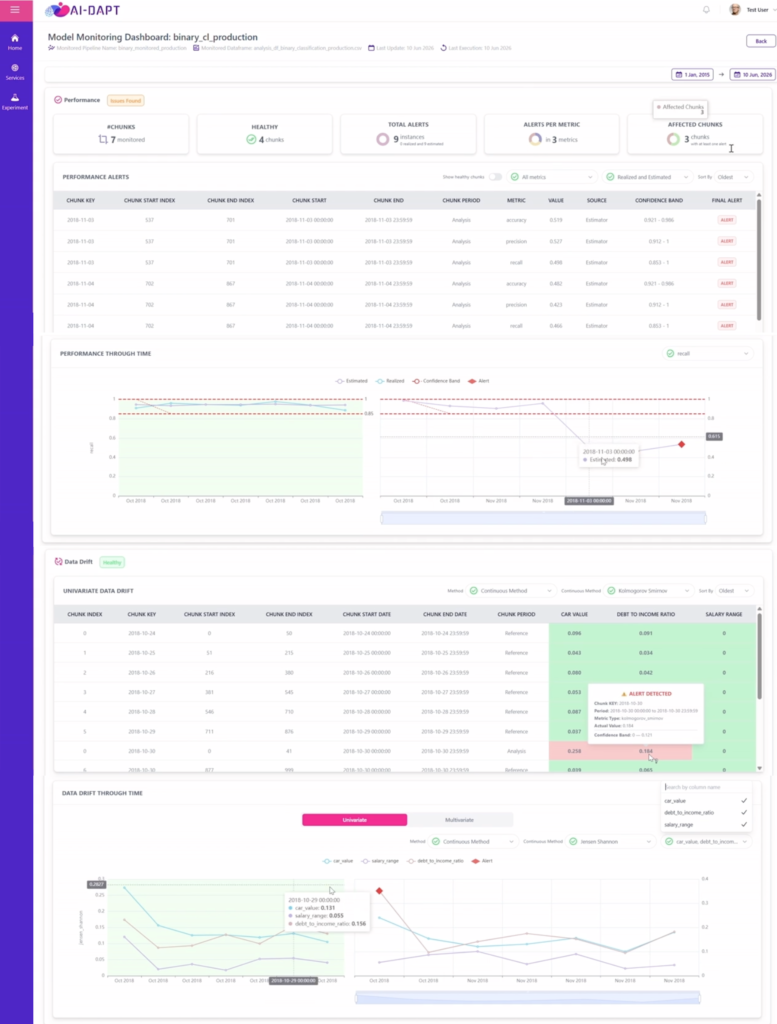
At the top of the dashboard, users can see high-level KPIs, such as the number of monitored chunks, monitoring duration, generated alerts and affected metrics. This gives an immediate overview of the current monitoring status. The dashboard then provides a chunk-level breakdown, to inspect which time periods or data segments triggered alerts and which remained within the expected range.
The performance-through-time view is a key feature of the dashboard, enabling users to compare the model’s baseline behaviour on the reference data with its monitored behaviour over time. The service distinguishes between realised and estimated performance. Realised performance refers to cases where ground truth labels are available, allowing the system to calculate actual performance. Estimated performance is used when ground truth labels are not yet available, allowing the system to provide an early indication of possible drift or degradation. This distinction is particularly relevant in production settings, where ground truth is often delayed. A model may generate predictions today, but the true outcome may only become available later. By supporting performance estimation, the Model Observability Service helps users identify potential issues earlier, instead of waiting until labels are available.
The dashboard also includes dedicated data drift views, where users can inspect univariate drift results for selected features, filter by metric or method, and analyse whether specific variables have moved outside the expected range. In addition, data drift over time charts help users understand whether changes are isolated to individual chunks, gradually emerging across time, or affecting multiple features as part of a broader shift in the data.
By combining KPIs, alerts, performance trends and drift analysis in the same interface, the Model Observability Service helps users move from detection to interpretation. It does not only show that an alert occurred, but also provides the context needed to understand where the alert came from, how the model is behaving, and whether further inspection or adaptation may be required.
From Observability to Adaptive AI
Observability becomes more valuable when it supports action. The Adaptive AI Service uses observability alerts and user-defined rules to help users decide what should happen when a model shows signs of degradation or drift. The service supports different types of condition-based rules:
- Temporal conditions, where an adaptation action is considered based on a predefined time condition.
- Metric-based conditions, where actions are considered when specific observability metrics violate defined thresholds. These conditions are directly linked to the Model Observability pipeline.
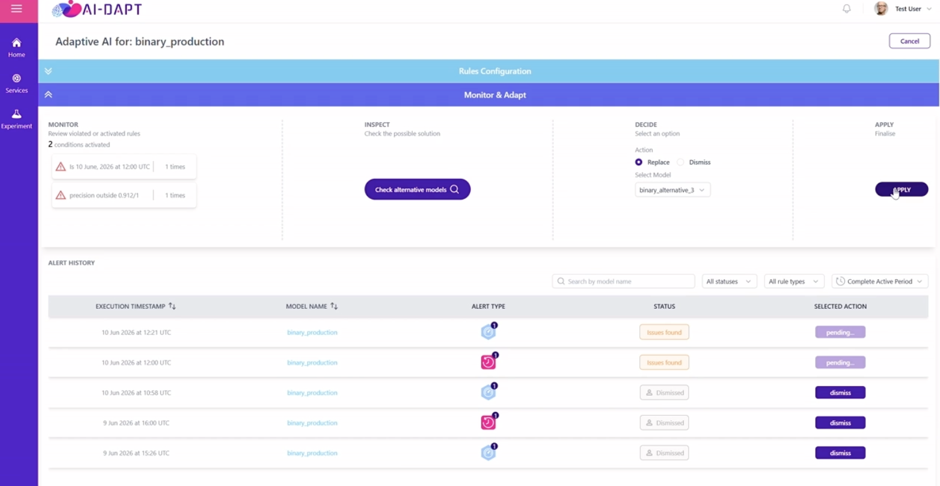
When a condition is met, the Adaptive AI Service can support different adaptation actions, such as retraining, rebuilding or replacing a model. Retraining may be used when the existing model should be updated with new data. Rebuilding may involve broader changes to the modelling pipeline. Replacing allows users to compare alternative models trained for the same problem and decide whether another model should be used instead.
As shown in Figure 5, users can inspect triggered alerts, review their status, and decide which adaptive action should be applied. This keeps adaptation connected to human oversight, since the service can generate alerts and recommendations, but users remain involved in inspecting the evidence, comparing alternatives and approving the adaptation action before it is applied. In the example shown, the available actions are to replace the model or dismiss the alert, reflecting the actions previously defined by the user in the adaptation rule.
Together, the Model Observability Service and the Adaptive AI Service help AI-DAPT move beyond static model deployment. They support an operational workflow in which models are continuously monitored, changes are detected, alerts are generated, and adaptation actions can be considered when needed. In this way, AI-DAPT supports a more trustworthy and lifecycle-oriented approach to AI deployment. Models are not treated as fixed artefacts, but as systems that need to be observed, evaluated and adapted as real-world conditions evolve.
Watch It in Action 🎥
To bring the Model Observability and Adaptive AI services to life, we are releasing a new video that shows them working together in the AI-DAPT platform.
The video demonstrates how users can configure a Model Observability project, select monitored and reference datasets, define aggregation settings, map columns, choose observability metrics, configure thresholds, inspect dashboards and alerts, and then use Adaptive AI rules to support actions such as retraining, rebuilding or replacing a model.
Stay tuned for future videos of our compoments!